Posted on Sat, 12 Sep 2020
Everyone in Singapore knows that movement was restricted during the circuit breaker between 7 Apr to 1 Jun 2020 so obviously, the traffic on the roads was reduced and so were congestions. However, are there numbers we can look at to give us a sense of the reduction?
Yes! Data collected by Traffic Observer (Traffico) have proven to be useful.
Before we start, it is important to recap some concepts on Traffico.
Imaging you are standing at a bus stop waiting for a bus. When a bus arrives at your stop, you note the time t1. Commuters get off and on the bus and it then heads to the subsequent bus stop. Once it reaches the next stop, your friend there notes the time t2. The actual journey time is simply t2 - t1 seconds.
It is intuitive to see that this journey time is affected by the following:
- traffic conditions; if there is a congestion, naturally, the bus takes longer to travel between 2 stops
- commuter activities; if there are many commuters boarding or alighting the bus (especially on rainy days, peak hours, etc.), the bus will stay longer at a bus stop, thus increasing the overall journey time
In reality, you and your friend are not at the bus stops, so who is keeping track? Turns out, bus arrival times from LTA can be used to estimate t1, t2 and consequently the journey time. See Analysing Bus Arrival Times — Findings for more details.
However, this approach of using arrival times is not fool proof. Remember, you and your friend work in real-time but the bus arrival times are only updated every minute so there are inherent limitations:
- if bus stops are too near, arrival times might not be captured correctly because within a minute, the bus might have travelled more than 2 stops
- if buses of the same service arrive too closely at a bus stop (i.e. bus bunching), arrival times get "messed up" and the calculated journey times becomes higher than it actually is, thus creating a false impression of a congestion.
It is unlikely for bus bunching to affect multiple services simultaneously. Hence, we use data from as many services as we can find along a route. For example, we use journey times of three services (12, 17 and 21) along Loyang Ave.
With enough samples collected, we can determine a particular threshold empirically. A journey time exceeding this threshold could be a sign of congestion. If a subsequent journey time exceeds this threshold again, then there is a higher chance of a real congestion.
That is how Traffico monitors bus arrival times to infer traffic conditions.
Let’s look at results from these 2 roads with some of the most consistent journey times:
| Road | Interval |
|---|---|
| Loyang Ave - TPE Junction (Towards Tampines) | Weekdays |
| Punggol Road - TPE Junction (Towards Sengkang) | Weekends |
Loyang Ave - TPE Junction (Towards Tampines)
 Map and Bus Details
Average Number of Buses on a Weekday

Rightfully, for every journey time calculated, there is a physical bus detected. However, due to bus bunching, there could be 2 or more buses in reality. For simplicity, let’s assume the instances of bus bunching are small and consistent throughout the months so that the relative trends are still preserved.
Looking at the 2018 line, you can see that the average number of buses detected on a weekday between Jan to Jun is around 270. However, in 2019, the average dropped to around 240, which represents a drop of roughly 30 buses across the 3 bus services a day.
During the circuit breaker, numbers dropped even further to an all-time low of 200. This should not come as a surprise because LTA has announced that buses will run at longer intervals.
The average number of buses per day has pretty much returned to 2019 figures in Jun 2020.
Journey Time Exceeding Threshold on Weekdays

Notice the journey times exceeding thresholds are consistently higher in 2019 than in 2018. Let’s recap the possible reasons for an increased journey time:
- buses are taking longer to travel between the stops due to more congestions
- commuters are taking longer to board or alight buses
- there are more occurrences of bus bunching, resulting in wrongly computed (i.e. higher-than-actual) journey times
Since we are tracking the same bus services and routes, on average, (c) would largely be consistent in a given month so it is unlikely to be the cause. We cannot rule out (a) occasionally but unless there is a persistent cause (e.g. roadworks for 6 months), it is unlikely for (a) to be the main contributing factor as well. Hence, it does appear that the most likely and direct cause is due to (b), since we discovered from the previous chart that the average number of buses has dropped in 2019. With a reduced frequency, more commuters would have been at bus stops or on buses and contributed to the boarding or alighting time.
During the circuit breaker, there was a 50% drop in Apr 2020 and 75% drop in May 2020 figures compared to the year before. The fall is also an alarming 64% comparing Mar to Apr 2020.
It appears that the figures in Jun 2020 have not returned to pre-circuit breaker levels yet. One possible reason is that most of the offices are still operating in some form of split team structure so not all staff have returned to work. Hence, the traffic passing through this route remains low.
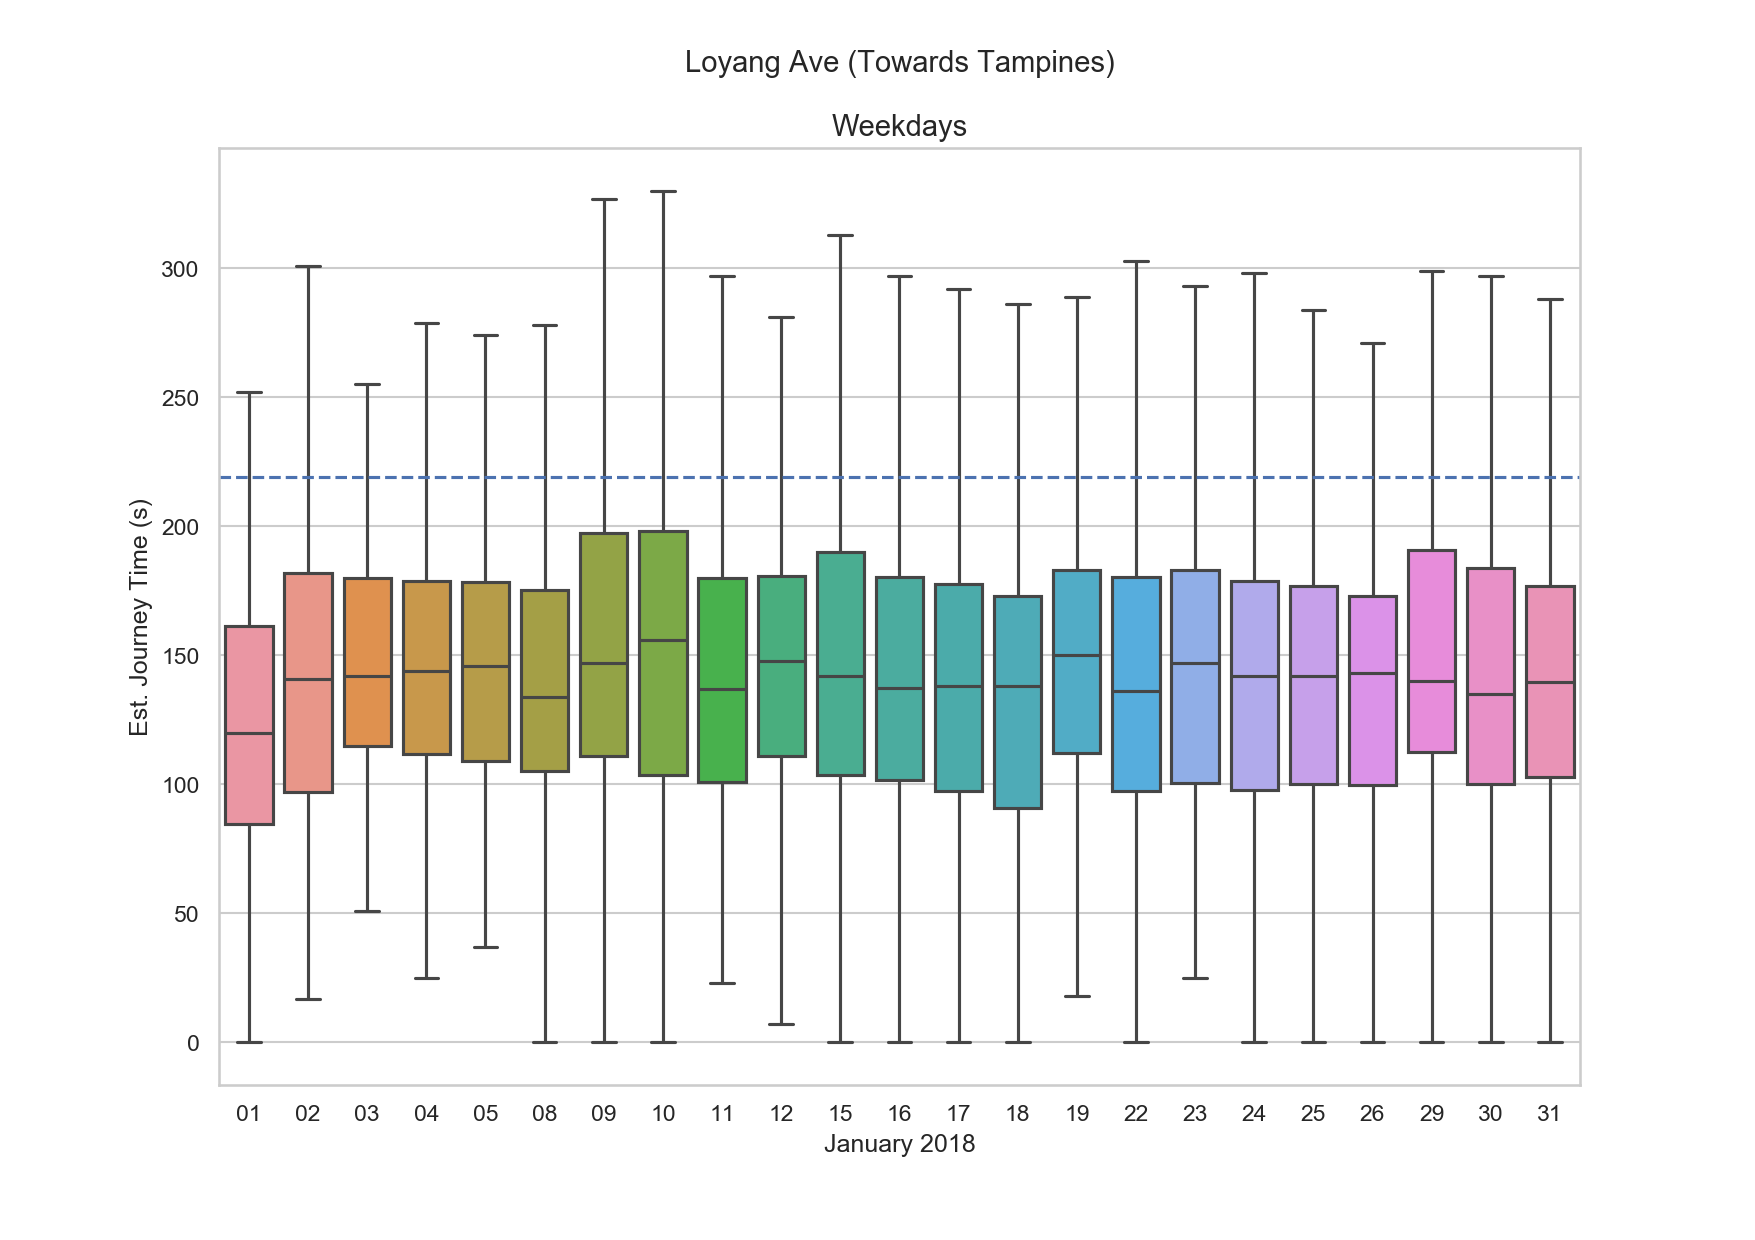
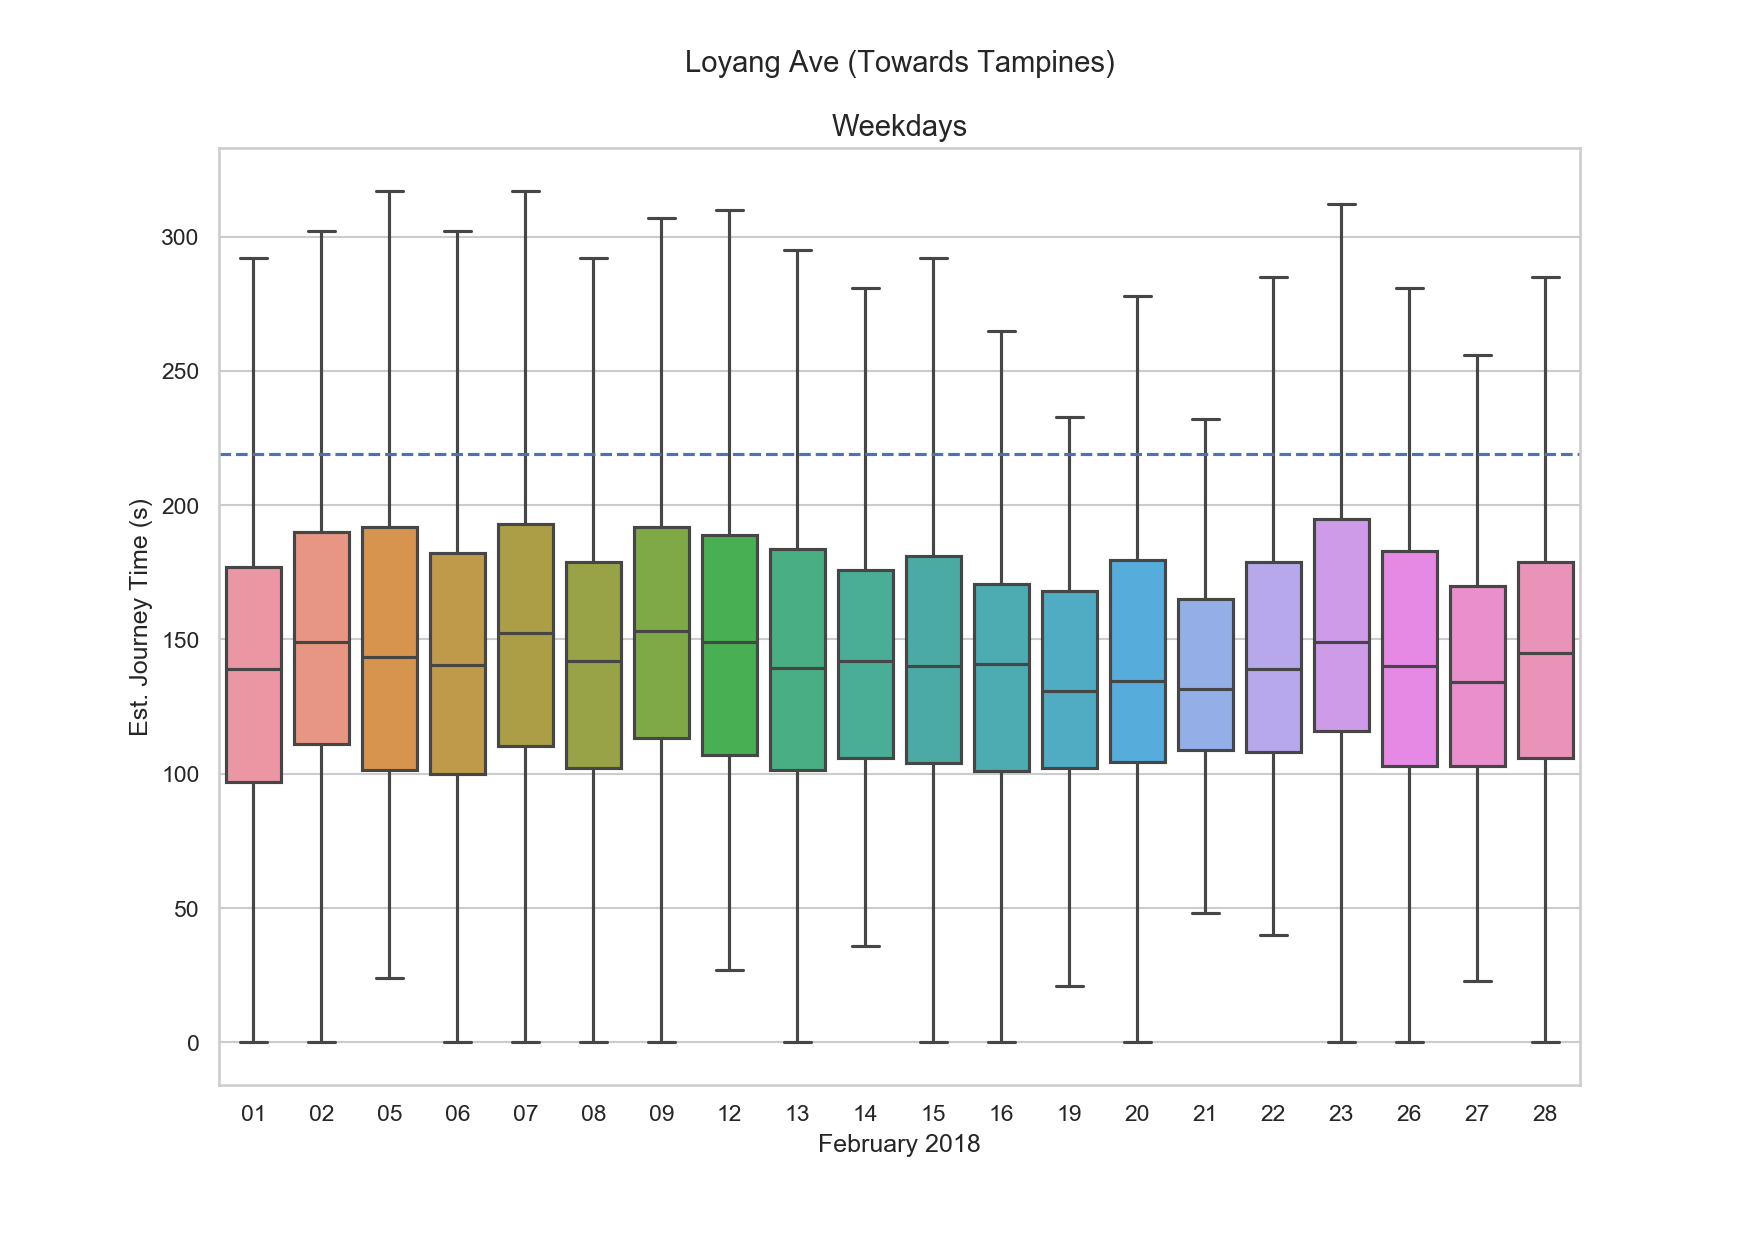
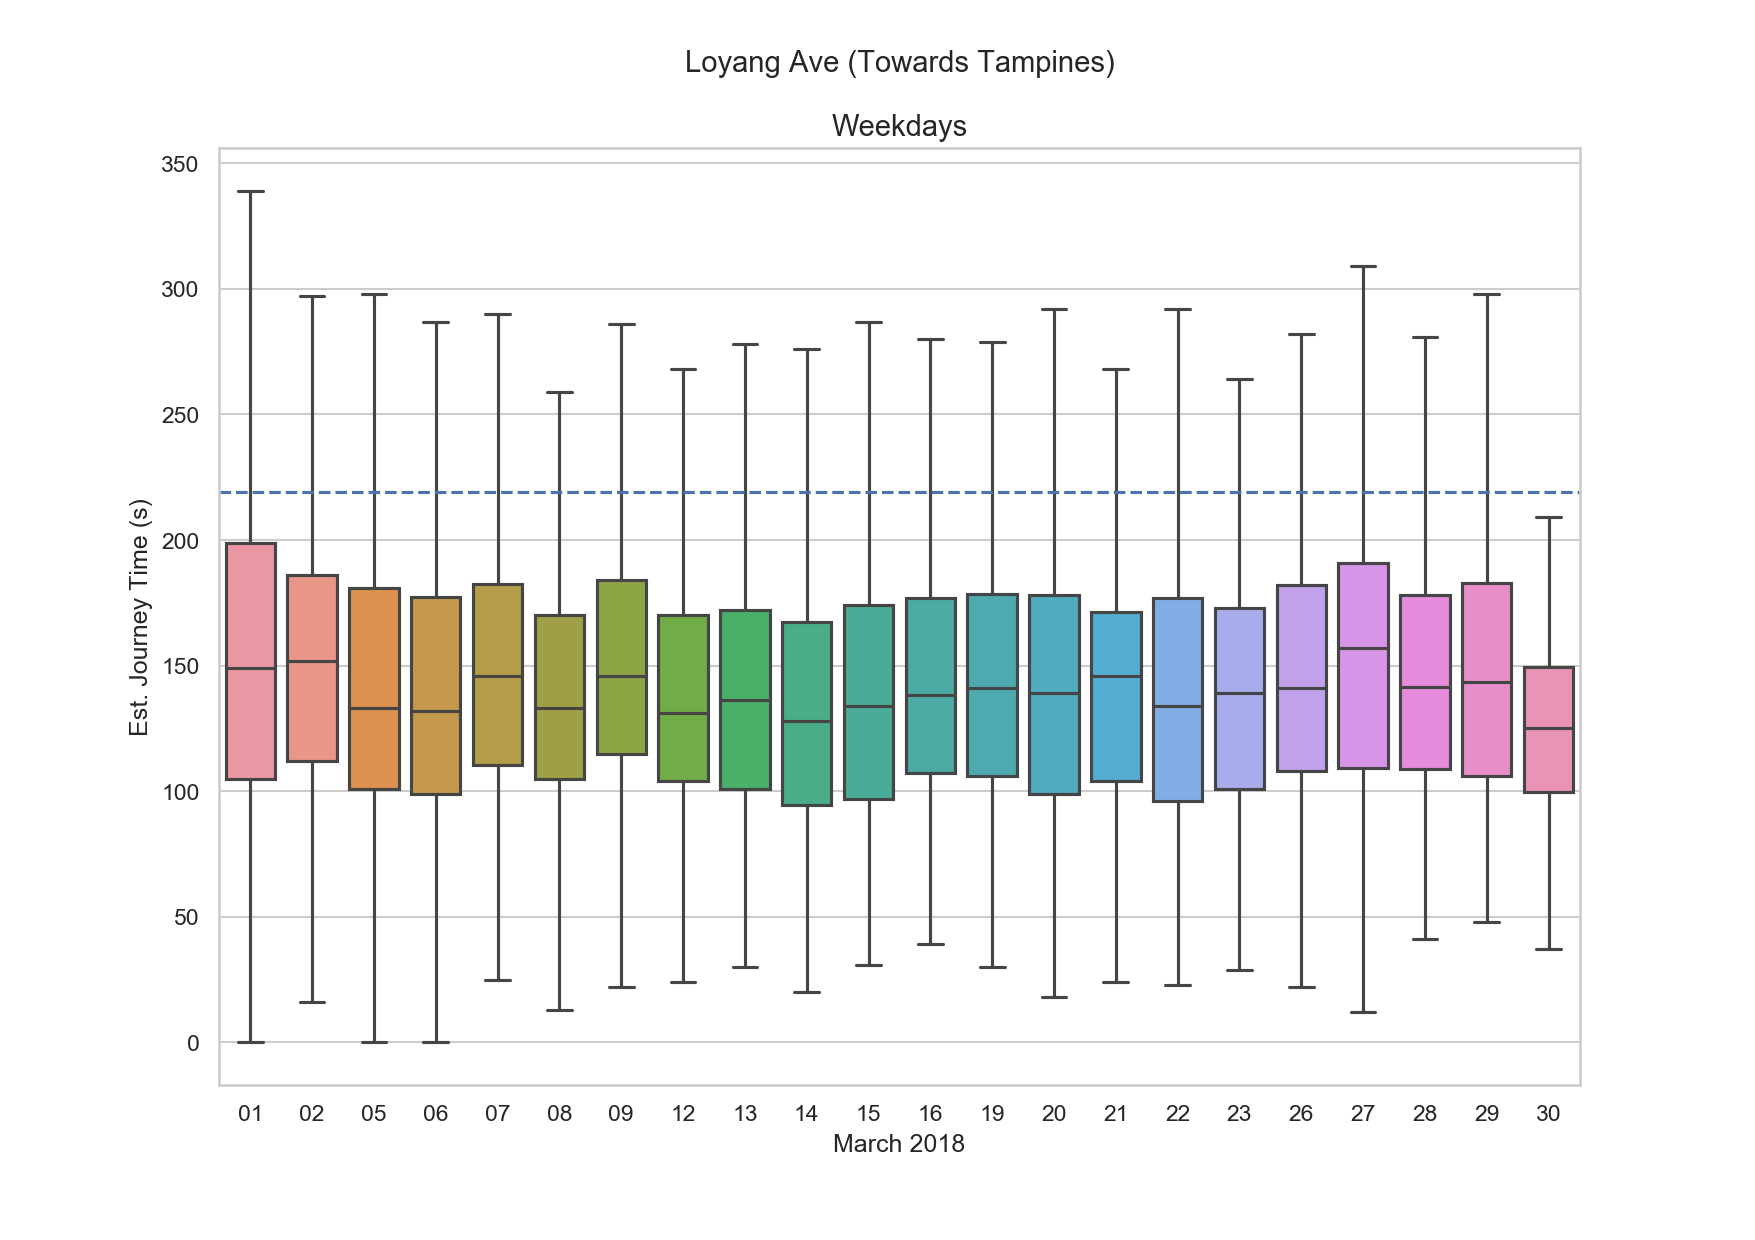
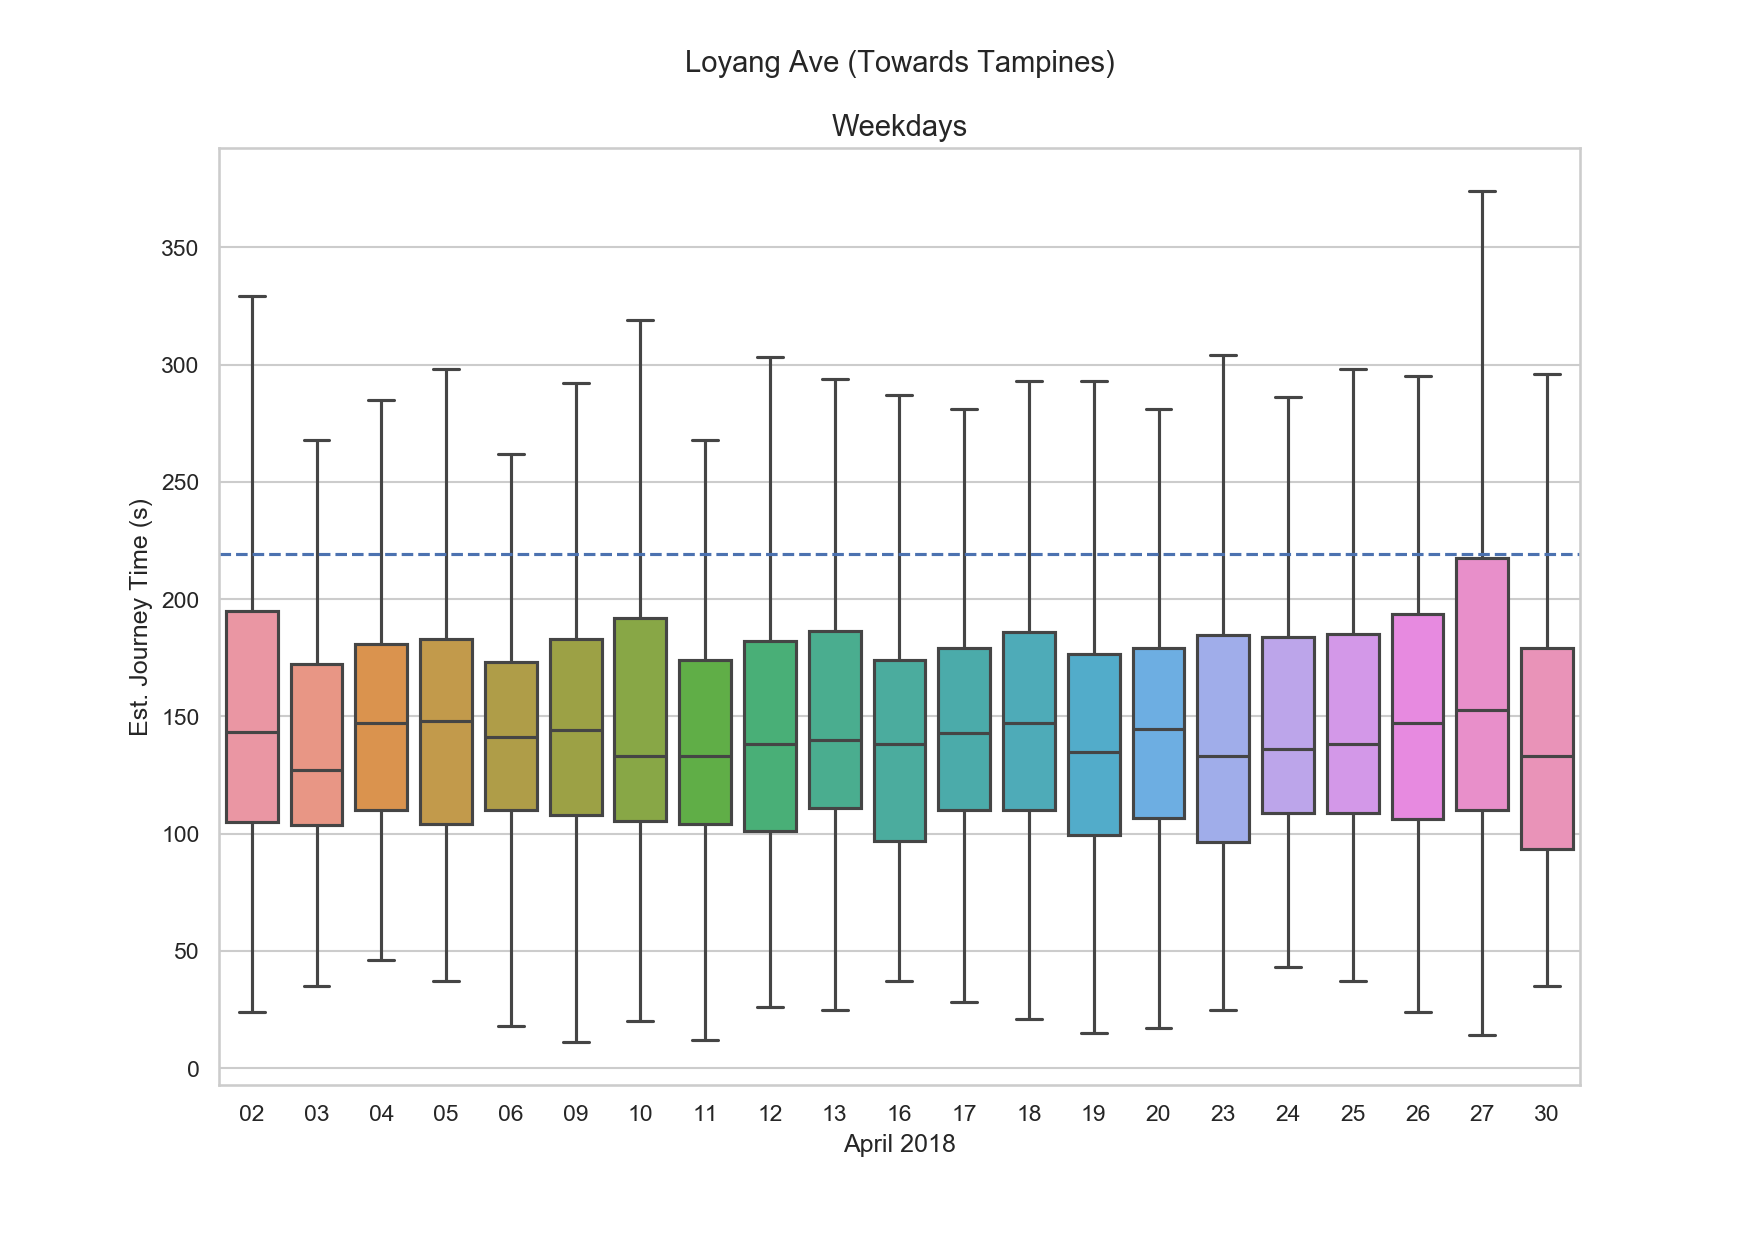
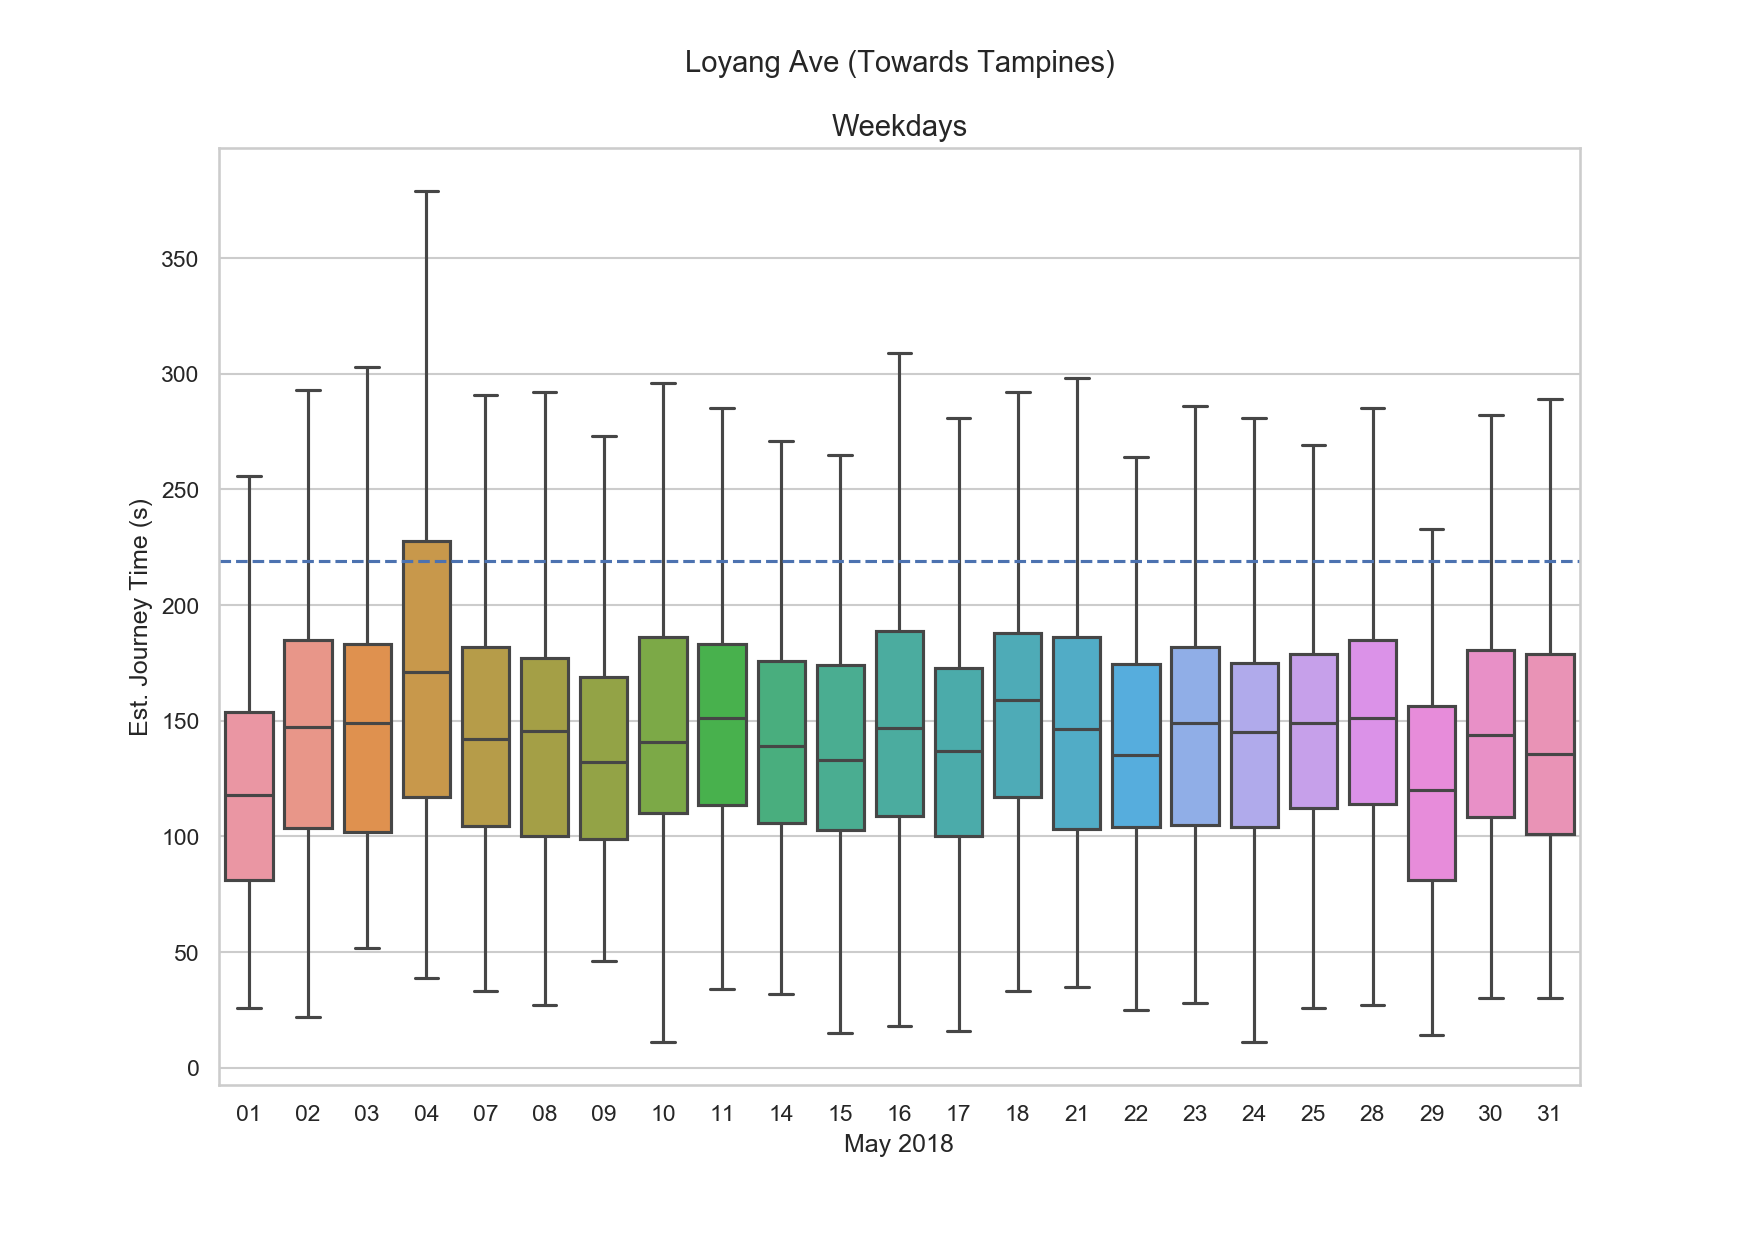
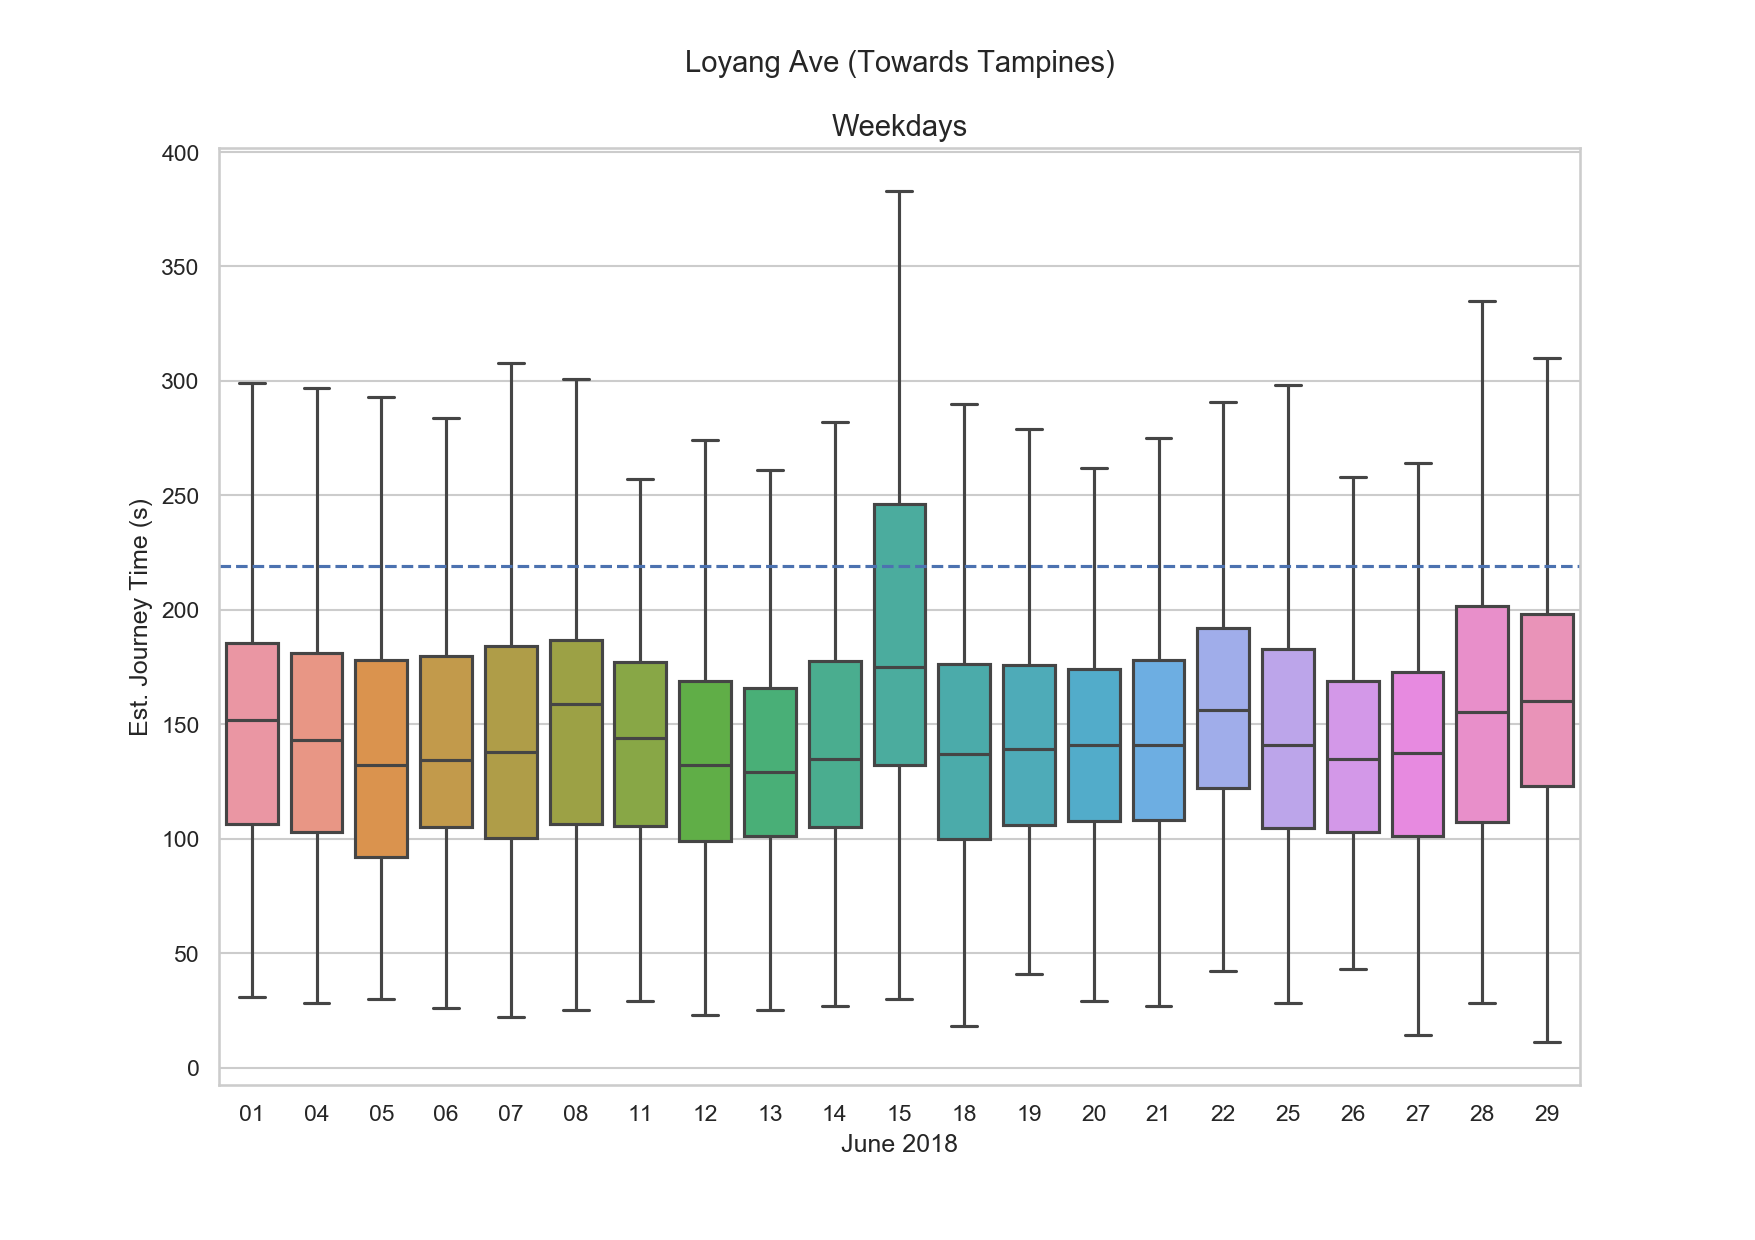
Box plots for the individual days in the months are shown below for your reference.


Punggol Road - TPE Junction (Towards Sengkang)
 Map and Bus Details
Average Number of Buses on a Weekend

The same trend is spotted here; the sharp drop during circuit breaker and figures returning to 2019 levels in Jun 2020.
Journey Time Exceeding Threshold on Weekends

As seen, for the first half of 2018, on average, about 35% of journey times exceeded the threshold. This figure is relatively high but not unrealistic. If you look through the infographics, you will see that this route has consistently been the top 5 congested routes since launch. Congestions accumulated on Saturday afternoons often hit 5 hours in total. It appears that the situation got better from Oct 2018 (ref: A year on - traffic profile along Punggol Road) though it is still slightly higher than the average computed for Loyang Ave.
Once again, figures in June 2020 have not returned to pre-circuit breaker levels yet.


